
DAY 4,生态环境监测界面
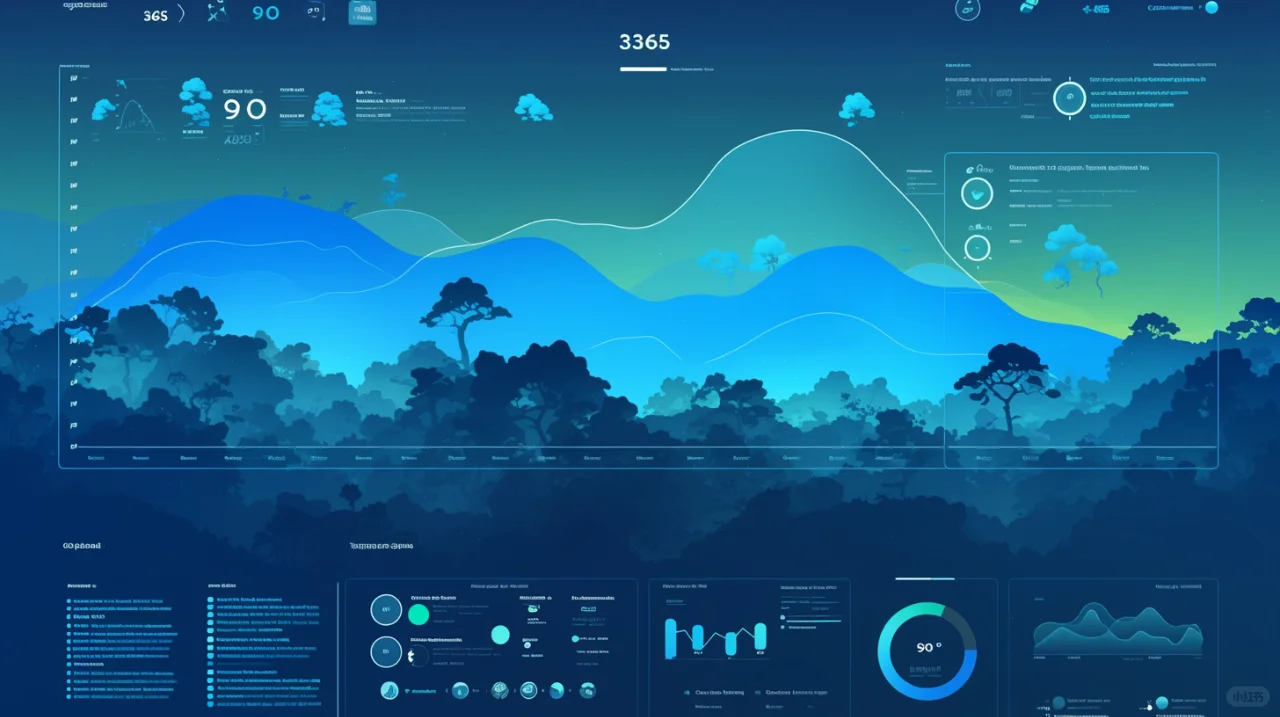
森林监测:
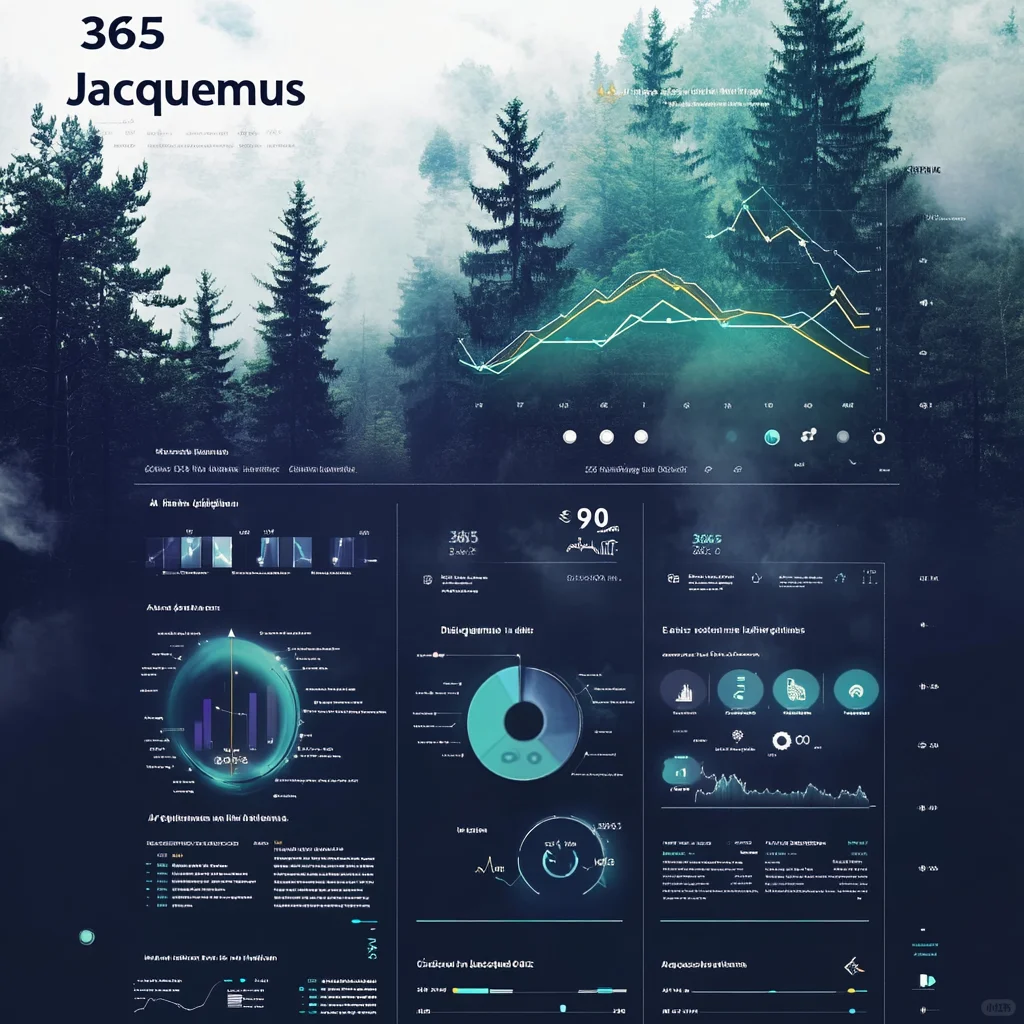
A screenshot of an interactive weather dashboard displaying the oxygen content, carbon dioxide concentration, and air index of the forest. The data is displayed on a map with a gradient background. There are also some infographics that display different charts, as well as basic charts that represent other information. In the upper left corner, there is \"365 Jacquemus\" written, followed by \"90\". Below is a pie chart showing data for approximately five regions, one of which is \"O Cooper Land blue/white --ar 16:9 --niji 6
#ai关键词 #mjdjourney #AI #AI绘画 #界面设计 #环境监测 #森林生态 #AI概念
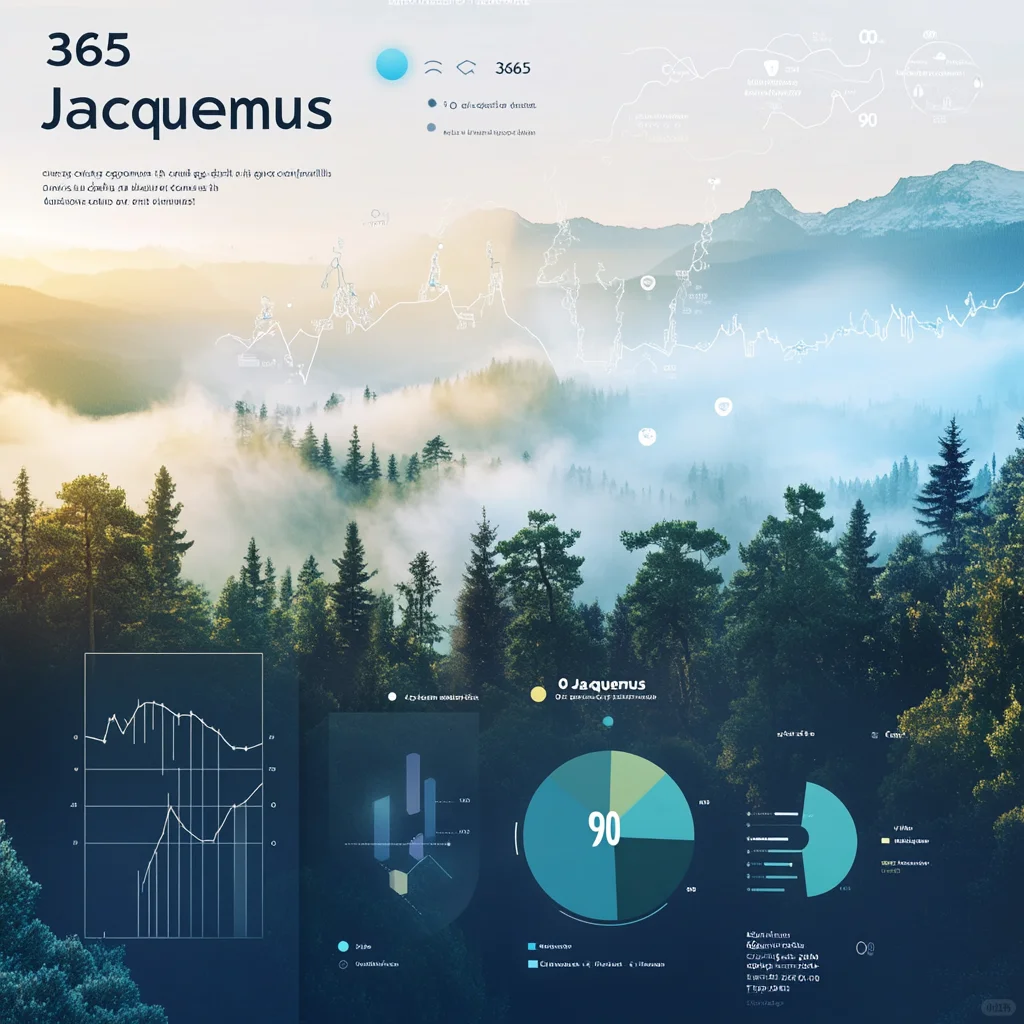
森林监测:
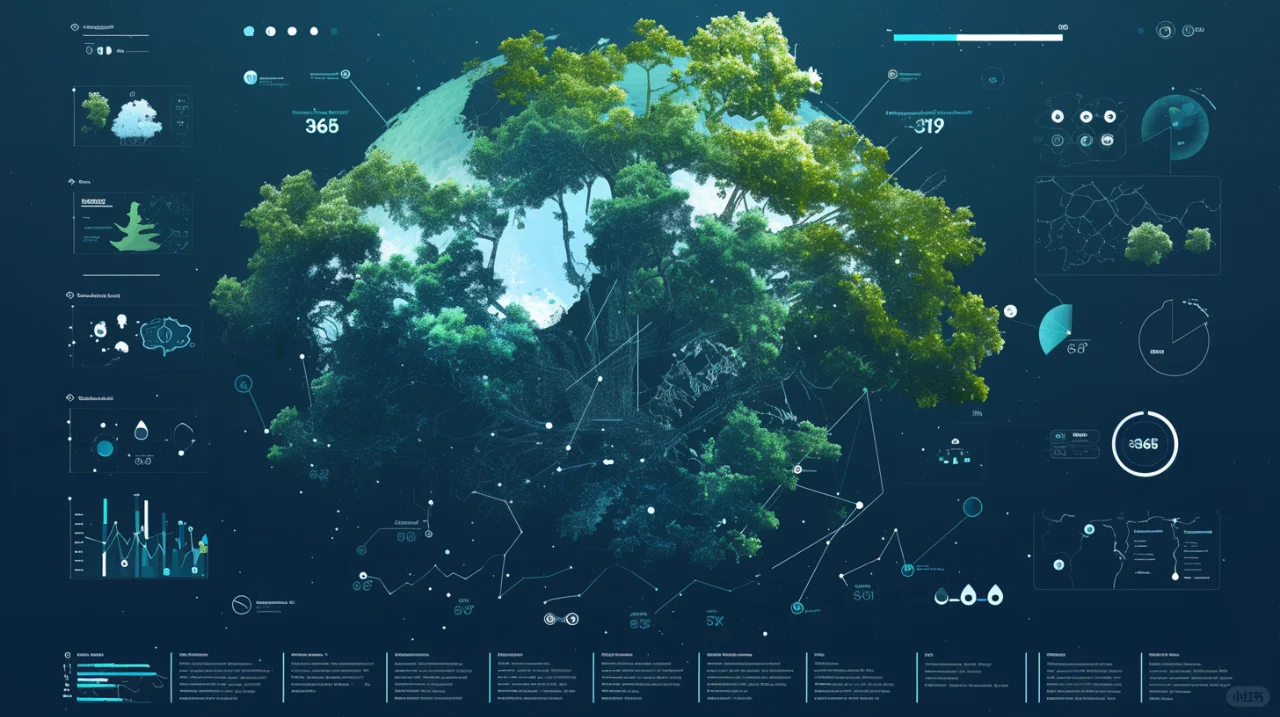
A screenshot of an interactive weather dashboard displaying the oxygen content, carbon dioxide concentration, and air index of the forest. The data is displayed on a map with a gradient background. There are also some infographics that display different charts, as well as basic charts that represent other information. In the upper left corner, there is \"365 Jacquemus\" written, followed by \"90\". Below is a pie chart showing data for approximately five regions, one of which is \"O Cooper Land blue/white --ar 16:9 --niji 6
#ai关键词 #mjdjourney #AI #AI绘画 #界面设计 #环境监测 #森林生态 #AI概念
